Chapter 6 Differential expression with DESeq2
DESeq2 performs differential expression analysis for RNA-seq count data.
obj <- readRDS("data/d1_qc_objects.rds")
dge_f <- obj$dge_f
meta <- obj$meta

library(DESeq2)

count_mat <- dge_f$counts
storage.mode(count_mat) <- "integer"
stopifnot(all(colnames(count_mat) == meta$sample))

dds <- DESeqDataSetFromMatrix(
  countData = count_mat,
  colData = as.data.frame(meta),
  design = ~ cellline + treatment
)

dds <- DESeq(dds)
6.1 Results
res_20_vs_nt <- results(dds, contrast = c("treatment", "20CTG", "NT"))
res_3_vs_nt <- results(dds, contrast = c("treatment", "3CTG", "NT"))
res_20_vs_3 <- results(dds, contrast = c("treatment", "20CTG", "3CTG"))

summary(res_20_vs_nt)
##
## out of 14704 with nonzero total read count
## adjusted p-value < 0.1
## LFC > 0 (up) : 541, 3.7%
## LFC < 0 (down) : 225, 1.5%
## outliers [1] : 0, 0%
## low counts [2] : 0, 0%
## (mean count < 4)
## [1] see 'cooksCutoff' argument of ?results
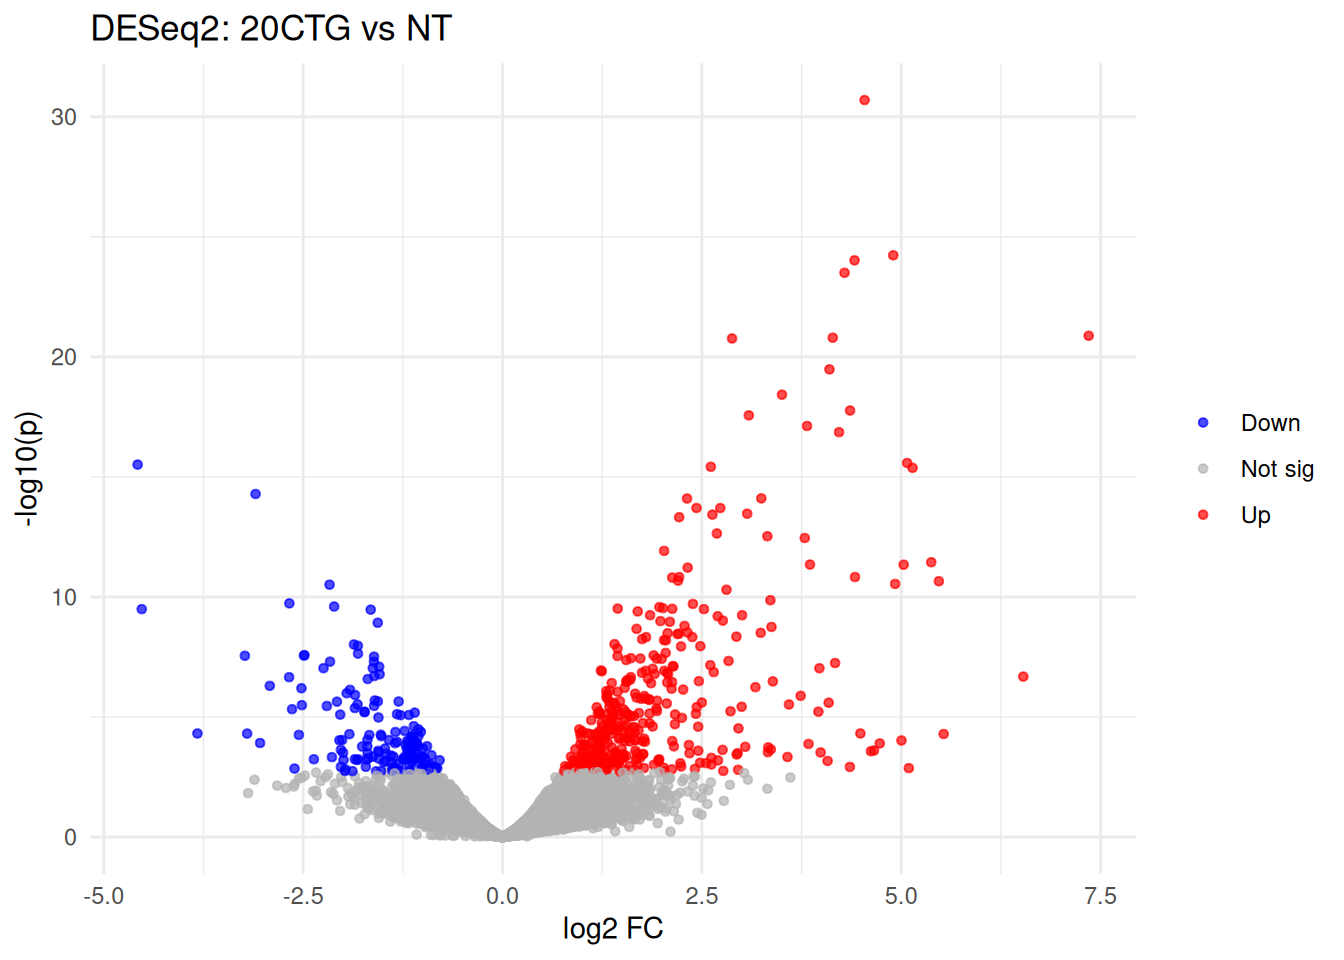
## [2] see 'independentFiltering' argument of ?results6.2 Volcano (red=up, blue=down)
library(ggplot2)
library(dplyr)
library(tibble)

vol <- as.data.frame(res_20_vs_nt) %>%
  rownames_to_column("gene") %>%
  mutate(
    neglog10p = -log10(pvalue),
    direction = case_when(
      !is.na(padj) & padj < 0.05 & log2FoldChange > 0 ~ "Up",
      !is.na(padj) & padj < 0.05 & log2FoldChange < 0 ~ "Down",
      TRUE ~ "Not sig"
    )
  )

ggplot(vol, aes(log2FoldChange, neglog10p)) +
  geom_point(aes(color = direction), alpha = 0.7, size = 1.2) +
  scale_color_manual(values = c(Up = "red", Down = "blue", `Not sig` = "grey70")) +
  theme_minimal() +
  labs(title = "DESeq2: 20CTG vs NT", x = "log2 FC", y = "-log10(p)", color = NULL)